Evidence in context
Semaglutide and glycemic status: what one visit can establish
Follow a measured value through classification, observation and time before deciding what a change means.
A number and a category answer different questions
Imagine a laboratory marker called X, measured in invented units. This is a fictional teaching device, not a clinical assay. Suppose its classification rule puts values below 10 in category A and values of 10 or more in category B. Compare two imaginary changes: 9.8 to 10.2 and 8.0 to 9.5. The first crosses the boundary despite changing by only 0.4 units. The second changes by 1.5 units while remaining in the same category. A category transition and the size of a change therefore give different answers about these records.
Neither description needs to replace the other. The continuous values preserve the distance traveled along the scale, while the category records a relationship to the chosen boundary. Knowing only that a record moved from A to B would not recover its starting value or its final value. Many pairs could satisfy that description. For either hypothetical change, its amount alone would not establish crossing without a starting position.
Keep the imaginary measurements and their classifications together. If the question concerns magnitude, the numerical change belongs in the answer. If it concerns membership in a defined category, the classification rule belongs there too. A disagreement between these summaries need not mean that a calculation failed: it may mean that two different questions were asked. The scientific task is to choose the question explicitly before deciding which summary would answer it.
Locate the randomized comparison
STEP-1 compared weekly subcutaneous semaglutide 2.4 mg with placebo, alongside lifestyle intervention, for 68 weeks in adults with overweight or obesity without diabetes.[1]
To examine assignment separately from classification, imagine a fictional roster prepared before an intervention begins. Each person has a category flag recorded at entry, and a random procedure assigns an intervention or a comparison condition. The flag and the assignment occupy different columns. Restricting attention to people with the same entry flag does not make that flag random; it merely defines which part of the roster is being considered.
In this hypothetical design, a comparison between assigned conditions asks about the consequences of assignment within the selected population. A comparison between the entry categories asks a different question. People cannot be treated as interchangeable across those categories simply because an intervention was randomized elsewhere in the worksheet. Any argument connecting the groups needs its own account of what differs between them and why those differences matter.
A third column would identify whose later observations are available. Selecting rows by that column is another operation, not a restatement of the original assignment. An analysis can therefore preserve the distinction between being assigned, belonging to an entry subgroup, and contributing a measurement. Extending its conclusion to a differently defined population would require an argument about that new population. Naming these columns prevents an intervention comparison from being mistaken for randomization of every characteristic attached to its participants.
Read the observation at its stated visit
Categories were investigator-assessed from observed in-trial data; week-68 assessment had no prior formal washout.[2]
Consider two fictional people observed using the invented marker X. One has a value below the imaginary cutoff at each scheduled observation. The other has values above it until the final observation, when the value falls below it. Both finish in category A. A summary containing only their final categories would make the records look alike, although the sequence of recorded classifications differs. This example concerns invented records, not the histories of study participants.
Even the longer sequence leaves a question open: what happened between observations? A line drawn between two measured points would be an interpolation, not another measurement. One fictional person could cross the boundary and return between visits without that excursion appearing in the scheduled record. A final category therefore cannot supply a complete history, and a sequence of matching categories does not automatically describe every intervening instant.
The wording of the target determines what can be concluded without adding such a history. Being in A at a specified observation is one target; being in A at every scheduled observation is another. Remaining in A continuously over an interval is more demanding still. The imaginary records distinguish the first two targets, but they do not contain continuous observation. Future status is a further question because it lies beyond either recorded history. A careful interpretation keeps these targets separate instead of letting the everyday meaning of a stable condition fill the spaces between measurements. This is a distinction about what an observation contains, not a proposed clinical definition.
Reading a category at one visit
On smaller screens, scroll within the chart to see all values.
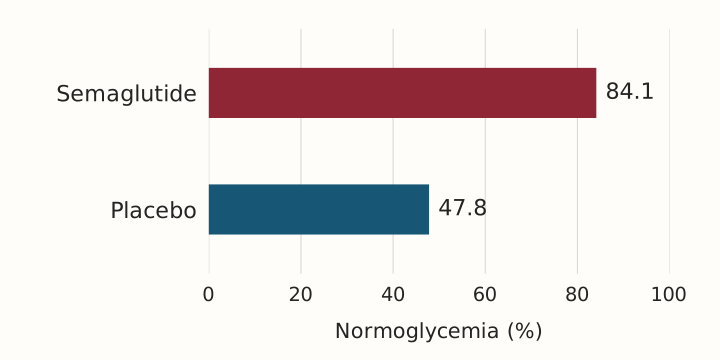
| Arm | Normoglycemia (%) |
|---|---|
| Semaglutide | 84.1 |
| Placebo | 47.8 |
Keep the direction of a transition
Build a separate, entirely hypothetical transition matrix for 20 people. Ten start in category A and ten in B. Of those starting in A, eight finish in A and two finish in B. Of those starting in B, six finish in A and four finish in B. These invented counts fill four cells, each of which retains both a starting category and an ending category.
The row beginning with A has ten people, so its transition fraction to B is two out of ten, or 20%. The row beginning with B also has ten people, and six out of ten, or 60%, move to A. At the end, 14 people are in A and six are in B. The final share in B is therefore six out of 20, or 30%. It is neither of the two directional transition fractions.
The hypothetical net change also has a different meaning. Six movements toward A are partly offset by two movements toward B, leaving four more people in A than at the start. Reporting only that net change would conceal movement in both directions. Reporting only the final category totals would conceal the starting positions. Neither summary establishes the incidence of a first event during the interval: that question would need an event definition, an eligible starting population and enough history to identify the event. The matrix records two classifications per person, not every possible transition between them.
Identify who supplies the denominator
Imagine a different cohort containing 20 initially eligible records. Sixteen have an assessment at the chosen occasion, and 12 of those meet a fictional endpoint. The observed proportion is 12 divided by 16, or 75%. Its denominator answers the question of how many assessed records supply the observation. Substituting the initial total would produce a different quantity, even though the numerator remained unchanged.
Four outcomes are unobserved in this invented example. If none met the endpoint, the full-cohort proportion would be 12 out of 20, or 60%. If all four met it, the proportion would be 16 out of 20, or 80%. These are logical bounds across possible completions of the fictional records. They are not confidence intervals, an imputation procedure or a statement about missing observations in a particular trial.
The bounds expose what is unknown without supplying its answer. Classifying every unobserved outcome as an endpoint failure would select the lower boundary; it would not turn those absent outcomes into measured failures. Assuming that the unobserved records resemble the observed records would introduce a different assumption, which would need its own justification. Neither choice follows from the original eligibility count. A randomized assignment also cannot fill an empty outcome cell. An interpretable report can preserve the initial population, the assessed population and the endpoint count as separate quantities, allowing the reader to see which question each denominator supports.
Separate a visit from durability
Imagine a fictional study with opening, middle and closing assessments, plus a separate record of whether an intervention continues during each interval. One target might be category A at the middle assessment. Another might be category A at every scheduled observation during a later period under a specified intervention condition. These targets differ in timing, required observations and the circumstances under which the observations are made.
To evaluate the second target, the hypothetical protocol would have to state when that period begins and ends, which occasions require assessment, and what happens if one is missed. It would also have to define the intervention condition being examined. Without those decisions, the word sustained could refer to incompatible summaries. Repeated scheduled observations could support a claim about those occasions without proving that no brief crossing occurred between them.
Exposure is part of the question rather than a detail to attach afterward. A measurement made while an intervention may still operate cannot, by itself, identify what would occur after that influence is absent. Establishing a sustained outcome under the latter condition would require observations that actually address it. This logical distinction supplies neither a waiting period nor a clinical criterion. It shows why changing the target from a visit classification to durability requires a new observation plan, rather than a stronger adjective applied to the same endpoint.
Test how a classification rule changes the summary
Return to the fictional marker X and its imaginary cutoff of 10. Suppose the analyst repeats the classification with a hypothetical cutoff of 9.7. The invented change from 9.8 to 10.2 now stays on the same side of the boundary; the measured values have not changed. This is a sensitivity exercise about the rule, not evidence that either cutoff is clinically appropriate.
A second fictional exercise can hold the cutoff fixed while allowing uncertainty around a measurement. Suppose, solely for illustration, that a recorded value could differ by up to 0.2 units in either direction. A value of 9.9 could lie on either side of 10, whereas a value of 8.0 would remain below it throughout that invented range. This does not estimate the error of an actual laboratory method. It identifies which classifications would depend on resolving the uncertainty specified in the exercise.
The distribution of measurements matters as well. In an imaginary collection concentrated just below a cutoff, a small common shift could produce many category crossings. The same shift among values far below it could produce none. Keeping the original values allows both explanations to be examined; retaining labels alone would discard that distinction. For a related discussion of what a measurement is being asked to represent, see the blood-test reading guide. The sensitivity question remains specific: which conclusion changes when the stated rule or assumed uncertainty changes?
Make classification decisions inspectable
Novo Nordisk funded trials and writing; the analyst was an employee-shareholder.[2]
A hypothetical classification audit can begin with a frozen set of invented records and a written rule. Two analysts apply that rule independently, retaining the original measurements and their assigned categories. Before comparing their answers, they also specify how rounding, boundary equality and unavailable values should be handled. Agreement then concerns a reproducible procedure, rather than an informal impression that the numbers look reasonable.
Consider an expressly imaginary value of 9.96 under the fictional cutoff of 10. Classifying the stored value and classifying a display rounded to one decimal place can yield different categories. If two analysts disagree for that reason, the useful response is to identify the order of operations that produced the disagreement. Changing a result without preserving the reason would remove information needed to understand the procedure.
After resolving the rule, the hypothetical audit could compare summaries based on original values with summaries based on categories. That comparison would reveal what the classification step adds and what it discards. A declared interest can prompt questions about responsibilities and oversight, but it does not identify a particular misclassified record. Evidence of an error would require showing the relevant data, rule and departure from it. This proposed exercise does not claim access to individual study records or a completed replication; it specifies what an independent check would need to make its result inspectable.
Define the next observation that would matter
A hypothetical follow-up study could declare its duration target before examining the outcomes. For example, it could ask whether a category is retained at every scheduled assessment within a defined period under a stated exposure condition. The protocol would specify the occasions, the classification rule and how an unavailable observation affects the target. An alternative target could concern only the final occasion. Choosing between them changes which records would count as satisfying the question.
The fictional records would then distinguish a return after an intervening crossing from uninterrupted membership at the scheduled observations. A plan should retain both the measured values and their timing so that this distinction can be checked. If the classification changed only when a boundary was slightly perturbed, that would pose a different interpretation problem from consistent movement far across the boundary. These are proposed comparisons, not claims about analyses already performed.
Prediction about one person requires another step. In the invented transition matrix, exchanging the identities attached to records would leave the group fractions unchanged. Those fractions alone therefore cannot identify whose category will change. A proposed prediction rule would need to state what information it uses before the outcome and be evaluated on observations beyond those used to construct it. That prediction question is developed in the companion study analysis. It is a different task from describing a group's completed transitions, not a comparison of treatments.
Keep a research category separate from a clinical decision
Wegovy injection’s listed indications include weight management; diabetes prevention is not a listed indication.[3]
Compounded medicines are not FDA-approved.[4]
Keep three questions visible: what does a research classification describe, what product claim is being made, and what is being asked about one person? A sentence that answers one of these questions should not silently become the answer to another. The connection needs an argument that identifies the relevant outcome, population and circumstances, rather than a shared word that makes the statements sound interchangeable.
The hypothetical marker in this article supplies a way to examine that reasoning, not a scale for interpreting a personal test result. Its categories were invented to expose the difference between a measurement, a rule and a conclusion. No personal health status follows from occupying either category, and no choice of care follows from the arithmetic.
These scope questions can accompany further reading through the related molecule reference, while a separate provider document belongs to a different kind of inquiry. A link between documents does not make a research comparison an evaluation or endorsement of a service. Keep the purpose of each document attached to the question it is being used to answer.
How to weigh the evidence
The strongest interpretation is the one whose measurement, population and time conditions can be reconstructed without supplying an unwritten assumption. The hypothetical exercises show that a change in category, a directional transition fraction and a final population share preserve different information. None is a substitute for all the others. A useful scientific account therefore retains the original measurements alongside the category rule and distinguishes the records eligible to contribute from those actually observed. Stronger claims should be matched to the additional observations they require. Duration calls for a defined temporal target; an individual forecast calls for a rule evaluated beyond its construction data. Uncertainty about those extensions need not erase an interpretable observation. It limits the extension of that observation, leaving a precise question that further evidence could answer.
Questions and answers
Does changing category describe how much a measurement changed?
No. In the fictional marker exercise, the smaller numerical change crosses a boundary while the larger change remains within one category. A category describes a relationship to a rule, not the distance traveled along the scale. To understand both aspects, retain the starting value, the ending value and the classification rule. Knowing only the transition cannot reconstruct the magnitude.
Can an observed proportion use the initial group as its denominator?
Only if the intended quantity and the available records justify that denominator. In the hypothetical incomplete cohort, the assessed records support an observed proportion; the initial group includes outcomes that remain unknown. Using the larger denominator while treating those outcomes as failures answers a different question. Keeping eligibility, availability and endpoint counts separate exposes that change instead of hiding it inside a percentage.
What would demonstrate a sustained change?
A proposed study would need a specified period, a defined exposure condition, scheduled observations and a rule for unavailable records. It must also distinguish remaining in a category at every scheduled occasion from remaining there continuously. In the hypothetical timelines, those are different targets. Repeated observations could address the first; a stronger description would require evidence that supports its additional timing claims.
Scope of this analysis
This analysis uses invented markers, cutoffs and records to examine measurement and inference. They are not clinical thresholds, study participants or instructions for interpreting personal results. The exercises do not estimate individual outcomes or establish a duration criterion for a clinical condition. Research classification, product scope and personal care remain separate questions.
Prepared with AI assistance. Medical review is pending. Editorial standards.
Sources
The dates below identify each source check. Publication of this page does not mean every source was checked again.