Evidence in context
Tirzepatide research and glycemic prediction: reading sensitivity carefully
Separate a rule’s ability to find later cases from the chance that a flagged person develops the outcome.
Ask which direction the probability runs
Imagine a completely fictional set of 100 people observed for a fixed period. Twenty eventually meet an invented outcome definition. A prediction rule flags 15 of those future cases and misses five. Among the 80 people who do not meet the outcome definition, it flags 40 and leaves 40 unflagged. These teaching records describe no actual participants. They let us examine the direction of a probability without attaching a clinical meaning to the flag.
Sensitivity starts with the cases: of the 20 people who eventually become cases, 15 were flagged, giving 75%. Specificity starts with the noncases: of those 80 people, 40 were unflagged, giving 50%. The two denominators answer different questions. Neither calculation starts with everyone who received a flag, so neither directly tells a flagged person the chance of becoming a case.
For that third question, return to the fictional flagged group. It contains the 15 flagged cases together with the 40 flagged noncases. The relevant fraction is therefore 15 out of 55. This is positive predictive value. Reversing the condition changes the group being examined, even though no person's record has changed. A statement can be arithmetically correct and still answer the wrong question if its denominator is left unstated.
Finish the phrase “among people who…” before considering a percentage. Eventual cases, eventual noncases and flagged people are three distinct starting points. Keeping those groups visible prevents a performance measure from quietly turning into a personal forecast.
Put the prediction inside a time horizon
SURMOUNT-1 randomized adults with overweight or obesity, without diabetes, to treatment plus lifestyle intervention; baseline prediabetes defined a planned 176-week treatment period.[1]
Consider two imaginary prediction exercises that use the same starting measurement but different deadlines. One asks whether an event occurs during the next year; the other asks whether it occurs during the next five years. A person with an event in year three belongs among noncases for the first target and among cases for the second. That difference need not represent a contradiction. The outcome includes its time limit.
Now suppose, still hypothetically, that everyone has the longer deadline, but some records end after one year. “No event recorded before contact ended” does not establish “no event by the deadline.” Treating both as noncases requires an assumption about the unobserved interval. An analysis would need a specified way to handle incomplete observation so that a short record cannot silently stand for a long one.
Treatment assignment and predictor membership also require separate reasoning. In an imagined randomized experiment, assignment would create the intervention comparison. Sorting those same records afterward by an initial marker would create a different comparison. The assignment process does not randomly assign marker values, nor does it guarantee equally complete follow-up within every marker category.
A finite forecast needs a starting point, an event definition, a deadline and an observation rule. Changing any of these changes what is being predicted. Extending a deadline creates a new analytical question.
Read the selected performance comparison
Placebo-only prediction was exploratory; the one-hour glucose analysis included 269 participants.[2]
A performance display becomes easier to interpret when each row is translated into a question about membership. For sensitivity, find the records that meet the later outcome definition and ask how many had the earlier flag. For specificity, find the records that remain noncases through the specified horizon and ask how many lacked the flag. A shared numerical scale makes the rows visually comparable; it does not give them a shared denominator.
In the fictional opening exercise, averaging the two rates would give the case group and noncase group equal influence, despite their different sizes. Counting correct classifications across everyone would instead weight each group's rate by that group's share of the population. These summaries answer different questions. A display can compare two rates on one scale without authorizing their sum or an unlabeled average as a single measure of accuracy.
Nor does a pair of performance measures supply an intervention contrast. A hypothetical claim that an intervention changes event frequency would require a comparison of outcomes under the relevant alternatives. A forecast asks whether an earlier classification separates later outcomes. Both questions can concern the same records while requiring different calculations and different assumptions. Numerical precision in one calculation cannot fill a missing comparison in the other.
Likewise, a rule for a later event and a rule for a condition already present have different reference outcomes. To move between them, the analyst would have to redefine the question and examine whether the classifications agree with that new target. The practical discipline is to read the population, measurement time and outcome horizon as part of the result, rather than treating a familiar metric name as a complete description.
Two denominators in a performance report
On smaller screens, scroll within the chart to see all values.
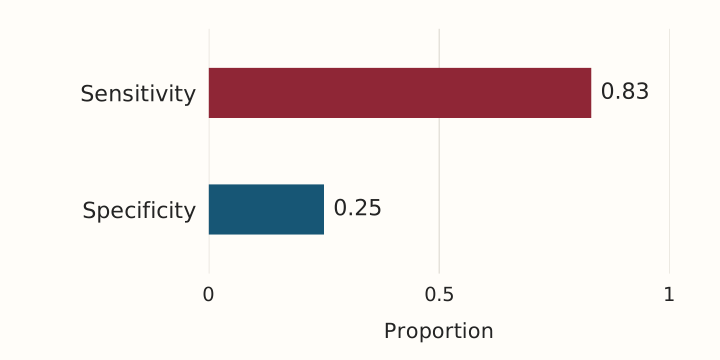
| Measure | Proportion |
|---|---|
| Sensitivity | 0.83 |
| Specificity | 0.25 |
Change the base rate without changing test properties
Consider two further fictional populations, each containing 1,000 people. Assume a rule has 80% sensitivity and 90% specificity in both populations. These are stipulated teaching properties, not measured estimates. In the first population, assume 10% become cases within the chosen horizon. In the second, assume 1% do. Holding the conditional properties fixed lets us isolate what changing the event frequency does to the flagged group.
The first invented population contains 100 cases and 900 noncases. The assumed sensitivity flags 80 cases. The assumed specificity leaves 90 noncases incorrectly flagged. There are consequently 170 flagged people, of whom 80 become cases. In the second population, eight of ten cases are flagged, alongside 99 of the 990 noncases. Its flagged group contains 107 people, with eight eventual cases.
The positive predictive values are thus 80/170 and 8/107. They differ because the rule draws its flagged people from differently sized pools of cases and noncases. A modest false-positive fraction applied to a large noncase pool can contribute many flagged records. Nothing in this arithmetic requires either assumed sensitivity or assumed specificity to deteriorate.
This exercise holds those properties constant deliberately. It does not establish that they would remain constant when a real population changes. For a proposed transfer, one would need to examine both the frequency of the target outcome and the rule's conditional performance in the intended setting. Borrowing a single percentage while ignoring either component leaves the expected composition of the flagged group unresolved.
Treat overlapping criteria as sets
Imagine eight fictional eventual cases. Criterion A identifies six, criterion B identifies four, and three are identified by both. Adding six and four counts those three shared people twice. The number identified by at least one criterion is six plus four minus three: seven. One of the eight cases remains unidentified by either criterion. The arithmetic describes sets of people, not ten separate successes.
In the fictional example, B adds one case after A is available: four minus the three already found. Reversing the order gives a different incremental count, because A contributes three cases beyond B. “How many does the second rule add?” therefore requires a stated first rule. The union stays the same when the attribution of incremental coverage changes.
These invented case counts say nothing about how either rule classifies noncases. To evaluate an either-rule strategy's specificity, we would also need the noncase sets, including their overlap. Finding another case could be accompanied by many additional flagged noncases, few, or none; the case-only exercise cannot decide which. Supplying that missing information is different from performing a cleverer operation on the case totals.
An intersection strategy asks yet another question: require both flags rather than either. In this fictional example it retains only the shared cases. Its consequences for noncases remain unknown for the same reason. Any comparison of combined rules must therefore specify the combination rule and retain both outcome groups, rather than calling a larger union an unqualified improvement.
Separate a predictor from a cause
Imagine a baseline marker X and a later event Y. In one hypothetical explanation, changing X would change the process leading to Y. In another, an unmeasured factor U would influence both X and Y, while changing X alone would leave the pathway to Y untouched. Either explanation could produce an association between the initial marker and the later outcome. An observed association by itself would not choose between these constructed explanations.
Prediction and intervention therefore pose different questions about outcomes. Prediction asks what outcome accompanies a marker value under the circumstances being observed. Intervention asks what would happen if a specified action changed those circumstances. Even a marker that sorted the fictional records perfectly would not, through that sorting alone, identify which action would alter the outcome.
Changing a category label is an especially clear example. If an analyst moved a fictional cutoff while leaving every person's underlying measurements and experiences unchanged, the number labeled high risk could change immediately. No future event would have been prevented by the relabeling itself. A lower count of high-risk labels and a lower count of later events are different outcomes that need different evidence.
A hypothetical investigation of an intervention would define the action, comparator, timing and outcome before comparing results. It would distinguish an effect of that action from a correlation involving the starting marker. Keeping these targets separate allows a predictive association to be examined without requiring it to carry an unsupported causal explanation.
Ask what a new population would test
Suppose an analyst develops an imaginary rule using one collection of records. Before examining a second collection, the analyst could freeze the inputs, cutoff, missing-value rule and outcome horizon. Applying that unchanged rule would test how the proposal travels. Repeatedly adjusting it after seeing the second collection would create another development exercise, needing its own subsequent check.
Different checks would answer different questions. Discrimination would ask whether the rule distinguishes records with different later outcomes. Calibration, for a rule that supplies probabilities, would ask whether observed frequencies correspond to the probabilities assigned. A binary flag alone does not supply a complete probability forecast; attaching a numerical risk to it would introduce an additional claim requiring evaluation.
In a hypothetical new population, the mix of starting characteristics could differ. The analyst could compare performance across clearly defined groups while retaining enough information to distinguish real uncertainty from an apparently tidy overall average. Such checks would need their own planned definitions. Searching many subdivisions until one looks favorable would not answer the same question as testing a specified concern.
Validation should also match the proposed use. If a rule is meant to inform a particular decision at a particular time, a check against a different outcome or deadline leaves that intended use partly untested. A successful calculation on new records would support only the target actually examined. Further claims would need further observations, rather than inheriting validity from the general word “validated.”
Audit the analytical responsibility
Lilly funded the study; the statistician was an employee-shareholder.[2]
An independent check can be concrete without assuming that a conflict establishes an error. Begin with a hypothetical frozen record set and a written rule. A second analyst would derive each record's flag, later outcome and observation status, explaining exclusions. Agreement on a final percentage would be more informative if both analysts also agreed on which records supplied its numerator and denominator.
Next, the check would distinguish a transcription problem from a change in the analytical target. If two fictional versions report different counts, the reviewer could compare eligibility rules, observation deadlines and treatment of incomplete records before deciding whether either count is wrong. Silently replacing one value with the other would hide the question that needs resolution. Conversely, a wording inconsistency would not by itself demonstrate that every separately reproducible calculation is invalid.
Version information matters because a formula can be correct while its inputs come from incompatible snapshots. In the proposed audit, every reported metric would point to the same frozen classification table and its stated rules. Recomputing the formula would then test arithmetic; rebuilding the table would test the preceding classification decisions. These are related checks, but passing one does not establish the other.
The resulting audit would distinguish different inputs, different definitions and an actual calculation error. It would identify what could change the estimate and what could leave it intact. Neither affiliation nor numerical neatness would substitute for that verification.
Specify the decision before choosing a metric
Imagine that a prediction flag could trigger a hypothetical action. To assess the rule for that purpose, define what the action is expected to accomplish and what happens when the flag is wrong. A false positive could carry a cost; a missed future case could carry another. These costs are assumptions in a decision exercise, not medical consequences established by the prediction calculation.
An analyst could compare candidate rules by weighting their expected false positives and missed cases under those explicit assumptions. A rule preferred when missed cases receive a large weight might lose that preference when false positives receive a larger weight. The ranking would therefore belong to the specified decision problem. It would not show that one performance measure is universally more valuable.
Before constructing that calculation, clarify whether the target is a category now, an event later or a change produced by an action. For that distinction, the companion study analysis offers a separate reading context for classification, while the blood-test reading guide provides another place to frame questions about measurements. Neither link supplies the missing consequences or validates an imagined action.
A defensible evaluation would make those missing pieces explicit and consider how the preferred rule changes when assumptions vary. If small changes reverse the preference, that would identify an unstable decision under the hypothetical model. It would call for better evidence about the influential assumptions, rather than greater confidence in a single sensitivity or specificity figure.
Keep exploratory prediction within its scope
Zepbound’s listed indications concern weight management and obstructive sleep apnea; diabetes prevention is not listed.[3]
Compounded medicines are not FDA-approved.[4]
A research criterion, a statement about a product and a conclusion about a particular person answer different questions. A criterion specifies how records are sorted for an analysis. A product statement concerns the scope of a named product's authorization. An individual decision would require a justified connection between that person's circumstances, the proposed action and the outcome of interest. A performance percentage cannot supply all three connections.
For readers organizing those distinctions, the related molecule reference is a separate reference entry. Likewise, a separate provider document is documentation about a provider, not an additional observation in a research dataset. Linking these documents does not turn the predictive exercise into an evaluation of a service or establish that a flag calls for a particular response.
The scientific task here is narrower and still substantial: define the target, preserve the correct denominator and ask which further observation could strengthen or overturn the interpretation. An explanation can make those questions clearer without producing a diagnosis, an individualized forecast or an instruction to obtain a test or change treatment.
How to weigh the evidence
A useful scientific reading starts by treating a forecast as a precisely defined relationship between an earlier classification and a later outcome. Its strength depends on maintaining that relationship through the denominator, observation window and population under consideration. The fictional exercises show why finding cases, excluding noncases and predicting what happens after a flag cannot be exchanged as though they were one property. They also show what a stronger investigation would need to add: explicit handling of incomplete observation, joint classifications for combined rules, and an unchanged rule examined against a defined target in new records. A decision claim would require another connection, from the forecast to the consequences of acting on it. Each additional step creates a testable question. Keeping those questions separate permits a result to be informative without assigning it a broader meaning than its calculation can support.
Questions and answers
Is sensitivity the chance that a flagged person becomes a case?
No. In the fictional opening table, sensitivity starts with the eventual cases and asks which were flagged earlier. A flagged person's outcome belongs to a different calculation, beginning with everyone flagged, including those who remain noncases. To interpret a forecast, specify that starting group and the outcome deadline before deciding which fraction answers the question.
Can counts from two risk criteria be added?
They can be added arithmetically, but the sum represents unique people only if nobody belongs to both groups. In the fictional overlap exercise, subtracting the intersection gives the union. That identifies coverage among cases. It still leaves combined specificity unresolved until the corresponding noncase classifications and their overlap are available. The needed denominator depends on the question.
What must happen before a prediction rule travels to another population?
A proposed check would apply a frozen rule to new records with a defined outcome and horizon. It would examine conditional performance and, if probabilities are supplied, calibration. The intended decision would also need evaluation under its own assumptions. Revising the rule during that exercise creates a revised proposal; it does not automatically validate the version that existed beforehand.
Scope of this analysis
This article is an educational interpretation of research, not individualized medical advice. All teaching populations, numerical exercises and proposed checks are hypothetical. They do not represent access to participant records, a replication or a completed validation. The discussion does not establish what a particular result means for an individual or recommend a clinical action.
Prepared with AI assistance. Medical review is pending. Editorial standards.
Sources
The dates below identify each source check. Publication of this page does not mean every source was checked again.